IoGAS IMDEX Masterclass: From Excel Data to Advanced Geochemical Analysis
Uncategorized
Wishlist Share
Share Course
Page Link
Share On Social Media

About Course

In the mining industry and geological exploration, geochemical data drives strategic decisions. However, knowing how to unlock its full potential remains a rare and highly sought-after skill.

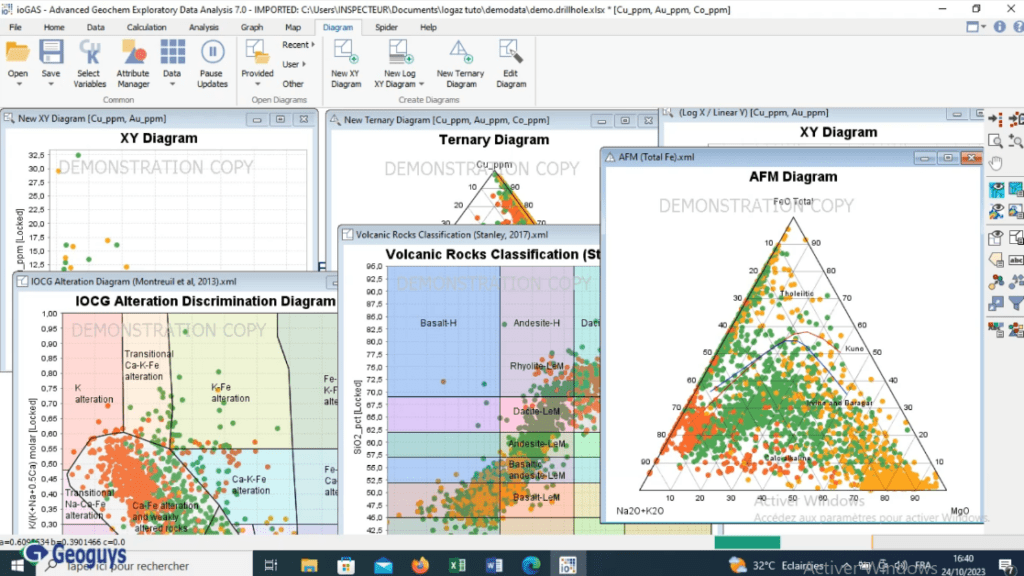
This practical training guides you step-by-step through IoGAS (IMDEX), the industry-standard software for visualization, quality control, and advanced interpretation of geochemical data. You will learn how to transform raw datasets into clear decision-making models, including anomaly maps, 2D/3D displays, and multivariate analyses.

Why Take This Course?

  • 100% Practical Approach: Hands-on experience working directly with real-world exploration datasets.

  • Designed by an Expert: Created by a seasoned mining professional with practical field experience.

  • Step-by-Step Progression: Clear, structured lessons that take you from beginner to confident user.

  • Lifetime Access: Study at your own pace and revisit the course material whenever needed.

Show More

What Will You Learn?

  • Master the IoGAS Interface: Navigate the workspace efficiently and customize display settings for optimal analysis.
  • Data Import & Cleaning: Load, verify, correct, normalize, and transform raw geochemical and drillhole data imported from Excel.
  • Statistical & Geochemical Diagrams: Construct and interpret frequency histograms, scatter/correlation plots, and ternary diagrams.
  • Geochemical Mapping: Develop spatial distribution maps, isoconcentration (isocontour) maps, and anomaly targeting maps.
  • 2D & 3D Drillhole Visualization: Project and display chemical grades along 2D and 3D drillhole trajectories.
  • Experimental & Structural Integration: Represent structural orientation data and overlay measurements on established reference diagrams.

Course Content

IoGAS Graphical Interface & Setup
Discover the main environment, toolbar navigation, and core features. Customize layout options and display preferences to increase productivity.

Data Import & Cleaning: Load, verify, correct, normalize, and transform raw geochemical and drillhole data imported from Excel.

Frequency, Correlation & Ternary Diagrams
Generate and interpret frequency distribution curves and histograms. Build correlation matrices and scatter plots to identify element associations. Construct ternary plots for lithological classification and alteration mapping.

Geochemical Mapping & Anomaly Detection
Produce element distribution maps to examine spatial trends. Build isoconcentration maps to delineate high-grade zones. Generate targeted anomaly maps for mineral exploration decision-making.

2D & 3D Drillhole Data Visualization
Integrate chemical analysis data directly onto drillhole sections. Render 2D and 3D visualizations to analyze depth vs. surface chemical trends. Track alteration vectors and mineral zonation patterns.

Structural Data & Reference Diagrams
Import and plot structural measurements (stereonets, structural vectors). Overlay field datasets onto standard experimental reference diagrams. Compare findings against geological models for advanced interpretation.

Student Ratings & Reviews

No Review Yet
No Review Yet